Drought
has been the rule since the fall of 2009 in parts of South Carolina. Only 6 out of the next 36 months saw above
normal rainfall in Columbia, South Carolina until 2013. Then the pattern changed and 2013 has been
wetter than normal. In fact, 4 out of
the last 6 months have been above normal and July is likely to add to that
total.
The
first week of July has been extremely wet. The airport has seen 2.19 inches of
rain while the city has received 4.35 inches of rain in just six days. July is normally the wettest month of the
year, but this year has been wetter than normal. In fact, the last two weeks have been quite
wet.
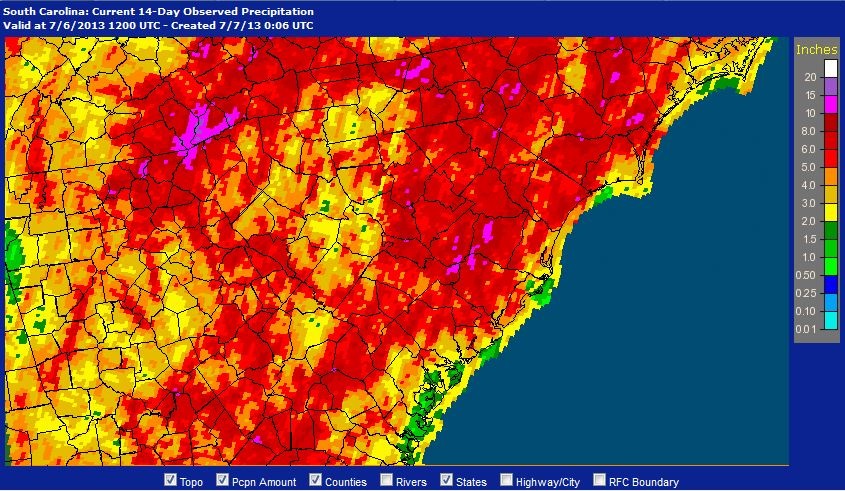
The
map below shows the observed rainfall across South Carolina for the past two
weeks ending on July 6. Note that the
area east of a line from Lancaster to Columbia to Barnwell has seen the
greatest rain with 10 to 15 inches of rain in eastern Orangeburg and
southeastern Clarendon counties. The
rain has been less west of the line until you get into the upstate of South
Carolina.
 |
| The 14-day observed rainfall ending at 8 a.m. July 6, 2013. Click on image for a larger view. Image Credit: NOAA/AHPS. |
Heavy
rainfall has resulted in significant rises in many of the rivers with minor
flooding of the Congaree River in the Columbia area. The Congaree Swamp has seen considerable
flooding over the past month closing some of the trails. This is likely to continue as much of the
flood waters from the Upstate have yet to pass through the Midlands.
So,
why is this happening? It turns out that
our weather is linked to a pattern which has caused record heat in the
Southwest and cooler than normal conditions in the Midwest.