Showing posts with label Extreme Weather. Show all posts

Sunday, July 9, 2023

The 2023 Heat Wave

Every year before summer starts people ask me if it is going to be a hot summer. I usually tell them that it is Columbia, South Carolina, of course it is going to be hot. However, this summer has been a little different and not what I expected. Let me give you a couple of examples. 
 
Columbia, South Carolina had its 13th coldest May on record (Avg. T=68.9˚F) this year. That was followed by the 17th coldest June on record (Avg. T=76.2˚F). So maybe it will not be so hot this summer. Then came July. The first 8 days have put the month on track for the 8th warmest July even though the highest temperature has been 95˚F. It has been the low temperature pushing the average up as it has put the month on track for the 3rd warmest low temperature. 
 
When you see the reports for Texas and the Southwest about the current heat wave this does not seem so bad. I was amazed how far north the heat has been driven. Take the example of the weather station at Norman Wells in the Northwest Territories in Canada. It is at about latitude 65˚N and yesterday it reported a high temperature of 100˚F. This beat its previous all-time high temperature record by 5˚F. On top of that it had visibilities of about a mile in smoke from wildfires. Truly epic. A cold front passed late in the day and winds shifted blowing up to 40 mph. This blew the smoke away and lowered the temperature. 
 
I have been following the media reports of the heat wave this year. As meteorologists we often do not know how the pattern will evolve until we get into the season. The models have not always given us a clear picture, but now we have a better sense of what lies ahead. 
 
High pressure in the middle of the atmosphere was centered over Texas early in the summer which was responsible for the start of the heat wave there. Over time it expanded and now stretches from Florida to Texas to the Southwest. The high pressure is centered over New Mexico and by the end of the week it will be over Arizona. This will push the heat wave into California and north to Washington state. 
 

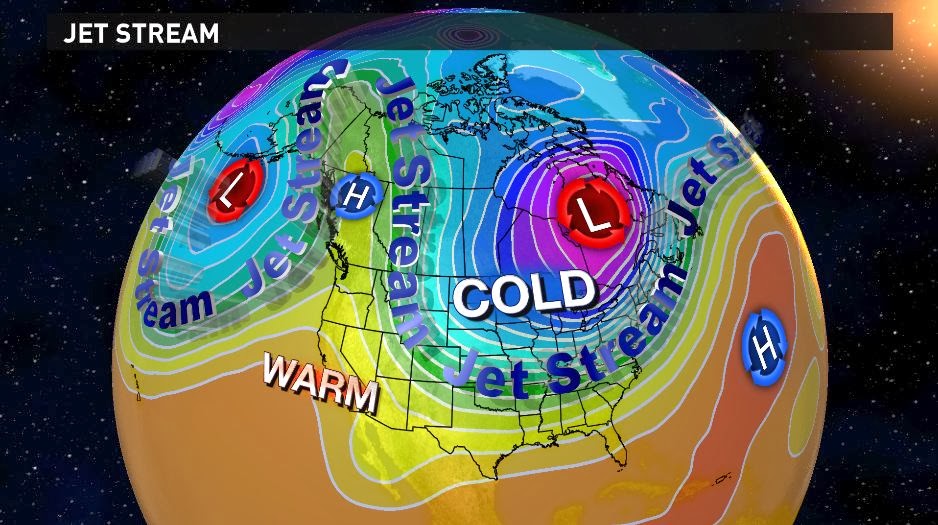
The atmospheric pattern at 500 mb (~18,000 ft.). This is the forecast for next Sunday July 16, 2023 from the European model. The H represents the center of the high pressure system and the L the low pressure system. These will not move much over the next week.


Temperatures will be hotter than normal across much of the southern U.S. by next weekend. Readings in Death Valley, California may approach 130˚F. Even in the central valley of California temperatures will be above 110˚F. (The lowest relative humidity I ever experienced was in Fresno, CA at 4%. It was drier than Death Valley.) Parts of South Carolina may approach 100˚F with heat indices in the range of 105-108˚F. No doubt the heat will continue to be news. 
 

Projected high temperatures for Sunday July 16, 2023 from the European model. Actual temperatures may differ slightly, but the overall pattern has higher confidence. It will be hot from the intermountain region, the Southwest, Texas into the Southeast.

 Notice the low-pressure system in Canada. The combined flow around it and the high over Arizona will push cooler air into the Midwest. The 6 to 10 day forecast reflects the evolving pattern. 


From the National Weather Service. This is the 6 to 10 day outlook for July 15-19 made on July 9. The cool weather in the central U.S. will be short-lived. The heat wave will begin to expand northward after this time.


 However, this will be temporary. The computer models suggest that the heat will begin to build north and east during the third week of July. The area that may escape much of the heat will likely be around the Great Lakes to the Northeast. 
 
Don’t think that this is the end of the story. I have only looked at the temperature here. There will be areas struck by severe thunderstorms and floods mainly in areas outside the heat wave. We have already seen examples of this over the past few weeks. Thus, the summer of extremes is likely to continue. 
 
I wonder what August will look like. 

Thursday, March 13, 2014

A Normal Winter?


The National Climatic Data Center (NCDC) released its analysis of the past winter today and the assessment for South Carolina? Near normal. The statewide average turned out to be the 66th coldest and 65th wettest winter on record.  The ranking was based on 120 years of data.


The statewide rank of temperatures (top) and precipitation (bottom) based on 120 years of records (since 1895).  A rank of 1 for temperature would be the coldest while for precipitation it would be the driest.  Click on the image for a larger view. Image credit: NOAA/NCDC.

Sunday, March 2, 2014

Coming in the Back Door


This winter has been a wild one for temperatures in South Carolina.  There have been big swings from hot to cold and back again.  Now that meteorological spring has begun (March 1st) the pattern continues.

A dramatic change to our weather is about to take place.  Cold arctic air is already in place across much of the central U.S.  Normally a cold front moving in from the west would bring the cold air to our state.  However, occasionally it comes in through the “back door”.

High pressure builds east and the cold air slides down the eastern seaboard faster than it can come in from the west.  It becomes trapped between the ocean to the east and the Appalachians to the west.  The cold front that surges south is known as a “back door” cold front.

Typically a wedge of cold air stays in place until something comes along to move the cold air out, which is a very difficult thing to do.  The result can be days of overcast skies and chilly northeast winds.

This time the back door cold front will be accompanied by a dramatic temperature drop.  When the front passes the temperatures will likely drop 20-25° F in an hour or two.  The front will be preceded by a band of rain which will begin the temperature drop.  Winds will shift from a westerly direction to a northerly direction as the front passes.  The winds will increase and there will be a wind chill to worry about in the late afternoon.

The RPM model forecast for 1:30 p.m. EST on Monday, March 3, 2014.  This is from the 21z run of the model using the 12 km grid.  Click on the image for a larger version.  Image Credit: WLTX-TV\WSI.

Saturday, February 22, 2014

Remembering #WinterMess 2


Little did we know that the winter storm at the end of January would be the prelude to a bigger storm two weeks later (February 11-13).  A complex storm system came through South Carolina in two waves.  The first occurred on Tuesday with snow over the northern Midlands and rain/sleet elsewhere.  This was followed by the main batch of precipitation on Wednesday ending Thursday morning.

Most of the snow occurred over the northern half of the Midlands.  It was mainly sleet with some snow in Columbia, but the precipitation became more snow farther north.  The northern most counties of the Midlands saw a considerable snowfall.

Total snowfall as of 7 a.m. Thursday, February 13, 2014.  This is based on observations from the National Weather Service Forecast Office in Columbia, SC.  Image Credit: WLTX-TV.

South of Columbia it will a sleet/freezing rain mix.  The farther south you went the more freezing rain occurred.  The southern Midlands saw the greatest accumulation of ice as shown on the map below.

Total ice accumulation as of 7 a.m. Thursday, February 13, 2014.  This is based on observations from the National Weather Service Forecast Office in Columbia, SC.  Image Credit: WLTX-TV.

The Midlands ended up on the dividing line between snow and ice.  The northern half saw a snowstorm while for the southern half saw an ice storm.  Travel became difficult if not impossible through some sections.  The worst of the storm occurred over the southern Midlands with the accumulation of ice.  An estimated 350,000 people lost power at the end of the storm.  Some were without power for over a week.  Schools remained closed for Wednesday through Friday with some of the northern counties closing schools on Tuesday.

Monday, February 10, 2014

#WinterMess the Sequel

And this time she means business!

The big picture described in yesterday’s blog post is still on track, but the details are a little different.  This is based on the latest computer model runs.  Basically, an upper-level system now in the southwestern part of the country will combine with a disturbance moving in from western Canada and will intensify over the Southeast.  This will induce a surface low to form first in the Gulf of Mexico and then off the Southeast coast.  High pressure over New England will push cold air into the Carolinas setting the stage for winter precipitation.  It will be a “big ol’ mess” when all comes together.

A Winter Weather Advisory has been issued for the northern midland counties of Saluda, Newberry, Fairfield, and Kershaw.  This will be for an accumulation of snow and sleet mainly Tuesday morning.  The following is an update from the previous post.

As mentioned yesterday the forecast is a difficult one based on the timing and various forms of winter precipitation that will occur.  The Midlands will see it all; rain, freezing rain, sleet, and snow.  It appears that the onset of precipitation will be late tonight as rain moves into the area.  The rain will likely change to snow during the early morning hours for the northern part of the Midlands (Saluda, Newberry, Fairfield, and Kershaw counties).  There could be enough accumulation to cause travel problems, so travel through the northern Midlands needs to be monitored.  The snow will change to rain and taper off during the afternoon.  This will be the first surge of moisture into the region.

A computer model view (RPM) of precipitation at 6 a.m. Tuesday.  This is from the 21z RPM model run.  The bluish areas are snow and could contain sleet.  The green areas are rain.  The pink is for a wintry mix.  Click on the image for a larger view.  Image Credit: WLTX-TV.

Sunday, February 9, 2014

Another #WinterMess?


Just two weeks ago a winter storm moved through the region producing a combination of rain, freezing rain, sleet, and snow.  Many thought this was it for the winter, but Mother Nature had other ideas.  Look here for a rundown of WinterMess #1.

Incredulously another winter storm is headed through the Southeast.  This time it will be a little different from the previous storm (i.e., no two storms are identical).  A complex weather pattern will develop over the Southeast with an upper-level disturbance moving east and helping to develop a low pressure system off the Carolina coast.  A surge of cold air will be pushing into the Carolinas ahead of this which will turn the rain into a wintry mix.

The models are a little better in converging on a solution.  There is still considerable uncertainty due to the tight area that the worst will fall.  A difference of just 20 miles can make a huge difference in the forecast even at this time range (less than 48 hours).

This blog post is designed to give you a heads up on our thinking and the time frame that things will occur.  There is only moderate confidence in the details, but the overall picture has good confidence.  The scenario and forecast that follows was derived from the 09z, 12z, 15z, and 18z runs of the WSI RPM model along with the 12z runs of the WRF, GFS, ECMWF, and GEM models on Sunday, February 9, 2014.  Each model is slightly different, but the details were mainly from the RPM model.  This represents my best guess at this point.

Friday, January 31, 2014

A Look Back at the #WinterMess


The snow that everyone graved finally came to the Midlands.  The same storm system that affected Birmingham and Atlanta also affected Columbia, SC.  Rain and sleet began to fall before noon on Tuesday, but it wasn’t enough to measure and didn’t cause any problems.  The lower atmosphere was quite dry so that it would take hours of light precipitation to moisten the atmosphere enough to allow for any significant precipitation.

Finally a band of rain/freezing rain moved across the southern half of the Midlands just before dark.  This was followed by snow in the northern part of the Midlands.  It eventually reached Columbia in the form of freezing rain.  At WLTX we pick up an ice accumulation of 1/10 of an inch before the precipitation changed over to snow.  The southern third of the Midlands saw ice accumulations of a ¼ to ½ inch.

The air was chilled by the rain/sleet/snow mix and temperatures fell below freezing over all of the Midlands shortly after sunset.  The precipitation changed to snow which fell mainly from 7:30 p.m. to about 2 a.m. across the Midlands.  Snow ended from west to east and the amounts didn’t vary a great deal across the Midlands.

A map of the midlands of South Carolina showing total snow depth as of Wednesday morning January 29, 2014.  This is from preliminary data.  Click on the image for a larger view.  Image Credit: NOAA/NWS/CAE.

Amounts were generally 2 to 3 inches across much of the area.  It was a wet snow which made for great snowmen and snowball fights.  Here is a view of the region from the satellite the next day:

Tuesday, January 28, 2014

A Major #WinterMess


The National Weather Service issued a Winter Storm Warning for all of the Midlands of South Carolina beginning at 11 a.m. Tuesday and ending at 9 a.m. Wednesday.  The warning was issued for significant accumulations of winter precipitation.  While the warning covers all of the Midlands the effects of the winter storm will be quite nuanced.

First, the jet stream in the upper atmosphere is diving far to the south from the Arctic region.  The term polar vortex was used earlier in January to describe to cold weather seen at that time.  Well, it’s baaaaack!  This time a piece of the polar vortex is centered just east of James Bay in Canada.  Cold Arctic air is plunging south to the Gulf coast and covering much of the Southeast.

The 500 mb pattern for 00z Tuesday, January 28, 2014.  Click on the image for a larger view.  Image Credit: WLTX-TV.

All of the computer models have been signaling this for the past few days.  However, their solutions have differed as to how and when the precipitation will develop across the Southeast.  Some of the models have brought the cold air in too fast resulting in primarily a snow forecast.  Others have slowed the advance of the cold air which has produced forecasts of freezing rain, sleet, and snow.

Sunday, January 26, 2014

A #wintermess for Tuesday, January 28, 2014


The National Weather Service issued a Winter Storm Watch for the midlands of South Carolina Sunday afternoon.  It is for the time period from Tuesday morning to Wednesday afternoon.  Immediately everyone was jumping up and down for joy over the prospect for snow.  Not so fast bucko!  Everything is not as it seems.

It took quite a bit of careful analysis to decipher what the scenario would be.  The computer models have been all over the place with this system; from no snow to more than 15” of snow.  Even our own in-house model has seen big run-to-run swings with 2 to 4 inches of snow in one run to no snow the next.  So what to do?

I have decided that the American model (GFS) seems to be preforming the best for now.  The NAM model has been showing wild swings run-to-run and the European model (ECMWF) seems too cold.  None of the models are perfect, but the GFS seems to be closest to actual observations in the forecast.

Thus, here is the forecast for Columbia, South Carolina over the next seven days.  This was posted Sunday, January 26, 2014:

The seven-day forecast posted Sunday, January 26, 2014 for Columbia, SC.  Click on the image for a larger view.  Image Credit: WLTX-TV.

Tuesday, January 21, 2014

A Cold End to January 2014


A weather pattern we have seen many times since late October, 2013, has reappeared in its amplified form.  The ridge of high pressure in the upper atmosphere has been building since late last week along the Pacific Coast, stretching from northwest Mexico to Alaska.  This has pushed the jet stream far to the north into Alaska and the Yukon. 

The 500 mb pattern for North American at 00z January 21, 2014.  Click on the image for a larger view.  Image Credit: WLTX-TV.

The result has been unseasonably warm temperatures for this time of year.  It is still cold, but in Fairbanks the temperature averaged 24° F above normal on Monday.  There have been wild swings in Fairbanks, AK, this month with its coldest temperature of -41° F on January 12th & 13th, and its warmest temperature at 34° F on January 17th.  On that day the temperature averaged 32° F above normal.

Alaskan temperatures at midnight January 21, 2014.  These are warm readings for central Alaska in January.  Click on the image for a larger view.  Image Credit: WLTX-TV.

Tuesday, January 14, 2014

The Polar Vortex & More


The first major North American weather event of 2014 was the cold Arctic outbreak in the first week of January.  The term polar vortex became the buzz word (in the media) for the cold outbreak, though it was much more.  As a previous post notes this was a pattern extending back to late October of 2013.

The term polar vortex has been around since the 1940s.  From the American Meteorological Society Glossary of Meteorology:

Polar vortex - (Also called polar cyclone, polar low, circumpolar whirl.) The planetary-scale cyclonic circulation, centered generally in the polar regions, extending from the middle troposphere to the stratosphere.

The westerly airflow is largely a manifestation of the thermal wind above the polar frontal zone of middle and subpolar latitudes. The vortex is strongest in winter when the pole-to-equator temperature gradient is strongest. In the Northern Hemisphere, the vortex has two centers in the mean, one near Baffin Island and the other over northeast Siberia.

I prefer to use the term Arctic outbreak to describe what happened in early January.  The polar vortex was involved, but the overall pattern was much more than the polar vortex.  The winds in the upper atmosphere plunged from northwestern Canada into the southeastern U.S. due to an amplification of the ridge of high pressure off the West coast and the deep trough over the eastern part of North America.

NASA put together a movie of temperature observations from NASA's Atmospheric Infrared Sounder (AIRS) instrument on NASA's Aqua spacecraft.  The Atmospheric Infrared Sounder, AIRS, in conjunction with the Advanced Microwave Sounding Unit, AMSU, sense emitted infrared and microwave radiation from the Earth to provide a three-dimensional look at Earth's weather and climate. Working in tandem, the two instruments make simultaneous observations all the way down to the Earth's surface, even in the presence of heavy clouds. With more than 2,000 channels sensing different regions of the atmosphere, the system creates a global, three-dimensional map of atmospheric temperature and humidity, cloud amounts and heights, greenhouse gas concentrations, and many other atmospheric phenomena. The AIRS and AMSU fly onboard NASA's Aqua spacecraft and are managed by the Jet Propulsion Laboratory, Pasadena, California, under contract to NASA. JPL is a division of the California Institute of Technology in Pasadena.

The temperatures shown are at a pressure of 850 hectopascals (hPa, also known as 850 mbs) which is at an altitude of 4500 to 5000 feet over much of the U.S. It begins on December 1, 2013 and runs through January 7, 2014.  The most obvious feature of the movie is the tongue of cold air moving out of Canada and southward to cover much of the eastern United States during early January 2014.


This is a picture of the last day of the movie, Tuesday, January 7, 2014.  The dark blue areas start at -12° C and become purple at -24° C.  This was the farthest extent south and the surface temperature dropped to 13° F in Columbia, SC, with a wind chill temperature of 3° F.  Click on the image for a larger view.  Image Credit: NASA.

Sunday, January 5, 2014

Arctic Cold? I'll take a Double!


The new year is taking up where the old year ended.  The weather pattern discussed in a previous post continues to dominate North America.  Each time the pattern amplifies with a strong ridge-trough-ridge look, cold air invades the U.S.  The pattern relaxes and becomes more zonal causing milder conditions to return.  This is the up and down pattern that has resulted in a roller coaster of temperatures.

This was the 500 mb pattern for North America at 12z December 9, 2013.  Note the ridge-trough-ridge pattern.  Click on the image for a larger view.  Image Credit: WSI.

This was the 500 mb pattern for North America at 00z January 6, 2014 (taken from the ECMWF model 12 hours earlier.  Note the ridge-trough-ridge pattern returns.  Click on the image for a larger view.  Image Credit: WSI.

However, this time there has been a bit of a twist.  A surge of cold, arctic air invaded much of the country at the end of last week.  The temperature in Columbia dropped to 22° F Saturday morning.  The high pressure center moved quickly to the east causing winds to shift bringing clouds back into the area before daybreak.  This locked in the cold air for the weekend and there wasn’t much of a rebound in temperatures.

Saturday, December 21, 2013

Weather's Ups & Downs


It has been like a roller coaster for temperatures since late October beginning with a freeze on the 26th Columbia, SC, when the temperature dropped to 30°F.  This came after an exceptionally warm fall.  Here is a look at the ups and downs since October 26th:

Month
Date
Temp

Oct
26
30°


30
82°

Nov
4
38°


6
77°


9
32°


10
72°


14
23°
New Record Low

18
85°
New Record High; Trace of Snow Evening

19
38°


22
76°


25
22°


26
71°


28
23°

Dec
6
82°
Record High Tied

13
25°


21
81°
New Record High

The forecast for the 22nd of December is for record high temperatures with much colder weather returning for Christmas Day.  Thus the roller coaster will continue for a while.

What is causing this?