Showing posts with label Weather Forecast. Show all posts

Wednesday, April 9, 2014

Time to Plant


I have been advising gardeners to delay planting tender plants this year due to a weather pattern that has been in place since late October, 2013.  The pattern made it more likely for a late freeze.  Normally the last freeze would occur in the Midlands by late March.  Most would simply wait until Easter, but Easter is quite late this year.  The latest freeze was on March 27th and it was a hard freeze with a low of 28° F.  It was very close to freezing on March 31st with a low of 33° F, but there was frost that morning.

Another 
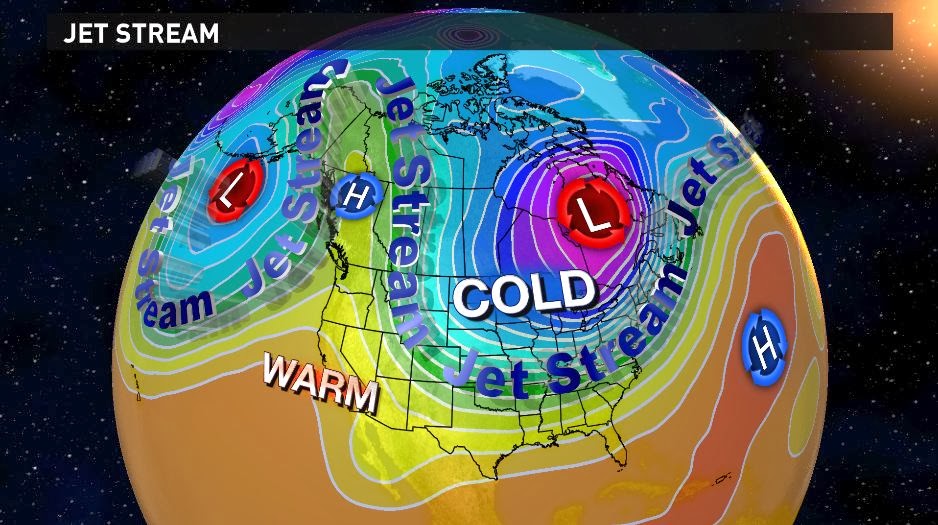
cold, dry air mass is making its way south and computer models have been suggesting that a frost or freeze might occur on Thursday, April 10th.  High pressure will settle over the area with clear skies, light winds, and dry air for Thursday morning.  The forecast for Columbia is for a low near 40° F that morning, but outlying areas may drop into the mid 30s.  This would be enough for a light frost in low-lying protected areas due to radiational cooling at night.

This will likely be the last chance of a frost or freeze.  If it does not happen then the previous dates will be the last freeze or frost.  The chance of a frost or freeze on April 10th was strong enough to advise gardeners to wait.  The seven-day forecast reveals that it will be time to plant this weekend.

The 7-day forecast made Wednesday, April 9, 2014 for Columbia, SC.  Click on the image for a larger view.  Image Credit: WLTX-TV.

Sunday, March 2, 2014

Coming in the Back Door


This winter has been a wild one for temperatures in South Carolina.  There have been big swings from hot to cold and back again.  Now that meteorological spring has begun (March 1st) the pattern continues.

A dramatic change to our weather is about to take place.  Cold arctic air is already in place across much of the central U.S.  Normally a cold front moving in from the west would bring the cold air to our state.  However, occasionally it comes in through the “back door”.

High pressure builds east and the cold air slides down the eastern seaboard faster than it can come in from the west.  It becomes trapped between the ocean to the east and the Appalachians to the west.  The cold front that surges south is known as a “back door” cold front.

Typically a wedge of cold air stays in place until something comes along to move the cold air out, which is a very difficult thing to do.  The result can be days of overcast skies and chilly northeast winds.

This time the back door cold front will be accompanied by a dramatic temperature drop.  When the front passes the temperatures will likely drop 20-25° F in an hour or two.  The front will be preceded by a band of rain which will begin the temperature drop.  Winds will shift from a westerly direction to a northerly direction as the front passes.  The winds will increase and there will be a wind chill to worry about in the late afternoon.

The RPM model forecast for 1:30 p.m. EST on Monday, March 3, 2014.  This is from the 21z run of the model using the 12 km grid.  Click on the image for a larger version.  Image Credit: WLTX-TV\WSI.

Wednesday, February 26, 2014

For Entertainment Purposes Only


For almost a week there has been a persistent rumor that another snowstorm is on the way.  I traced this back to radio spreading the rumor that Farmers’ Almanac had predicted the past two snowstorms and was predicting a third.  I was frequently asked if there was another snowstorm on the way, for which I answered no.  The response was almost always “Well, Farmers’ Almanac is predicting another snowstorm and it predicted the last two.” What?

So I investigated this claim.  First let me point out that there is a Farmers’ Almanac (dating back to 1818) and an Old Farmer’s Almanac (dating back to 1792).  It was Old Farmer’s Almanac that was predicting snow.  Second the forecasts are so vague as to be of little value.  Neither ever forecasted sleet or freezing rain and thus the ice that was so devastating.

Yet there were a few that were adamant that Old Farmer’s Almanac got it right.  If that is the case, then why ever watch the media.  Let’s explore the claim.

I do not have the forecast breakdown for January, but I did get it for February.  For the period of February 7-14, the forecast is for “periods rain and snow, then sunny, cold”.  It was during this period that the snowstorm occurred (11-13).  But, wait!  The forecast is for the entire region from south Georgia to southeast Virginia.  It also includes the Piedmont as well as coastal areas.

Does this forecast apply equally to all locations?  Are we to apply this with rain in the south and snow in the north?  If so, where is the rain/snow line?  Where is there any mention of ice?  Where does it even say snowstorm?  Merriam-Webster Dictionary defines snowstorm as a disturbance of the atmosphere marked by a heavy amount of precipitation in the form of small white ice crystals.  In their forecast how much snow will fall?

Saturday, February 22, 2014

Remembering #WinterMess 2


Little did we know that the winter storm at the end of January would be the prelude to a bigger storm two weeks later (February 11-13).  A complex storm system came through South Carolina in two waves.  The first occurred on Tuesday with snow over the northern Midlands and rain/sleet elsewhere.  This was followed by the main batch of precipitation on Wednesday ending Thursday morning.

Most of the snow occurred over the northern half of the Midlands.  It was mainly sleet with some snow in Columbia, but the precipitation became more snow farther north.  The northern most counties of the Midlands saw a considerable snowfall.

Total snowfall as of 7 a.m. Thursday, February 13, 2014.  This is based on observations from the National Weather Service Forecast Office in Columbia, SC.  Image Credit: WLTX-TV.

South of Columbia it will a sleet/freezing rain mix.  The farther south you went the more freezing rain occurred.  The southern Midlands saw the greatest accumulation of ice as shown on the map below.

Total ice accumulation as of 7 a.m. Thursday, February 13, 2014.  This is based on observations from the National Weather Service Forecast Office in Columbia, SC.  Image Credit: WLTX-TV.

The Midlands ended up on the dividing line between snow and ice.  The northern half saw a snowstorm while for the southern half saw an ice storm.  Travel became difficult if not impossible through some sections.  The worst of the storm occurred over the southern Midlands with the accumulation of ice.  An estimated 350,000 people lost power at the end of the storm.  Some were without power for over a week.  Schools remained closed for Wednesday through Friday with some of the northern counties closing schools on Tuesday.

Tuesday, February 18, 2014

The #BigMelt


There is finally some relief after a week of snow and ice followed by an earthquake.  It was quite cold this past week following the 12th coldest January on record for Columbia.  It was the 11th coldest for South Carolina as a whole in January.  The weather warmed after the first winter storm at the end of January.  Little did we know that it was a warm-up act for the next winter storm.

Most of the snow and ice melted as the sun returned on Friday and a warming trend began.  A cold shot of air on Saturday only slowed the melt, but the warming trend continued on Sunday.  This week will be noticeably warmer this week.  In fact, temperatures will be in the mid to upper 70s by Thursday.

The 7-day forecast for Columbia, SC, for February 18-24, 2014.  Click on the image for a larger view.  Image Credit: WLTX-TV.

Monday, February 10, 2014

#WinterMess the Sequel

And this time she means business!

The big picture described in yesterday’s blog post is still on track, but the details are a little different.  This is based on the latest computer model runs.  Basically, an upper-level system now in the southwestern part of the country will combine with a disturbance moving in from western Canada and will intensify over the Southeast.  This will induce a surface low to form first in the Gulf of Mexico and then off the Southeast coast.  High pressure over New England will push cold air into the Carolinas setting the stage for winter precipitation.  It will be a “big ol’ mess” when all comes together.

A Winter Weather Advisory has been issued for the northern midland counties of Saluda, Newberry, Fairfield, and Kershaw.  This will be for an accumulation of snow and sleet mainly Tuesday morning.  The following is an update from the previous post.

As mentioned yesterday the forecast is a difficult one based on the timing and various forms of winter precipitation that will occur.  The Midlands will see it all; rain, freezing rain, sleet, and snow.  It appears that the onset of precipitation will be late tonight as rain moves into the area.  The rain will likely change to snow during the early morning hours for the northern part of the Midlands (Saluda, Newberry, Fairfield, and Kershaw counties).  There could be enough accumulation to cause travel problems, so travel through the northern Midlands needs to be monitored.  The snow will change to rain and taper off during the afternoon.  This will be the first surge of moisture into the region.

A computer model view (RPM) of precipitation at 6 a.m. Tuesday.  This is from the 21z RPM model run.  The bluish areas are snow and could contain sleet.  The green areas are rain.  The pink is for a wintry mix.  Click on the image for a larger view.  Image Credit: WLTX-TV.

Sunday, February 9, 2014

Another #WinterMess?


Just two weeks ago a winter storm moved through the region producing a combination of rain, freezing rain, sleet, and snow.  Many thought this was it for the winter, but Mother Nature had other ideas.  Look here for a rundown of WinterMess #1.

Incredulously another winter storm is headed through the Southeast.  This time it will be a little different from the previous storm (i.e., no two storms are identical).  A complex weather pattern will develop over the Southeast with an upper-level disturbance moving east and helping to develop a low pressure system off the Carolina coast.  A surge of cold air will be pushing into the Carolinas ahead of this which will turn the rain into a wintry mix.

The models are a little better in converging on a solution.  There is still considerable uncertainty due to the tight area that the worst will fall.  A difference of just 20 miles can make a huge difference in the forecast even at this time range (less than 48 hours).

This blog post is designed to give you a heads up on our thinking and the time frame that things will occur.  There is only moderate confidence in the details, but the overall picture has good confidence.  The scenario and forecast that follows was derived from the 09z, 12z, 15z, and 18z runs of the WSI RPM model along with the 12z runs of the WRF, GFS, ECMWF, and GEM models on Sunday, February 9, 2014.  Each model is slightly different, but the details were mainly from the RPM model.  This represents my best guess at this point.

Tuesday, January 28, 2014

A Major #WinterMess


The National Weather Service issued a Winter Storm Warning for all of the Midlands of South Carolina beginning at 11 a.m. Tuesday and ending at 9 a.m. Wednesday.  The warning was issued for significant accumulations of winter precipitation.  While the warning covers all of the Midlands the effects of the winter storm will be quite nuanced.

First, the jet stream in the upper atmosphere is diving far to the south from the Arctic region.  The term polar vortex was used earlier in January to describe to cold weather seen at that time.  Well, it’s baaaaack!  This time a piece of the polar vortex is centered just east of James Bay in Canada.  Cold Arctic air is plunging south to the Gulf coast and covering much of the Southeast.

The 500 mb pattern for 00z Tuesday, January 28, 2014.  Click on the image for a larger view.  Image Credit: WLTX-TV.

All of the computer models have been signaling this for the past few days.  However, their solutions have differed as to how and when the precipitation will develop across the Southeast.  Some of the models have brought the cold air in too fast resulting in primarily a snow forecast.  Others have slowed the advance of the cold air which has produced forecasts of freezing rain, sleet, and snow.

Sunday, January 26, 2014

A #wintermess for Tuesday, January 28, 2014


The National Weather Service issued a Winter Storm Watch for the midlands of South Carolina Sunday afternoon.  It is for the time period from Tuesday morning to Wednesday afternoon.  Immediately everyone was jumping up and down for joy over the prospect for snow.  Not so fast bucko!  Everything is not as it seems.

It took quite a bit of careful analysis to decipher what the scenario would be.  The computer models have been all over the place with this system; from no snow to more than 15” of snow.  Even our own in-house model has seen big run-to-run swings with 2 to 4 inches of snow in one run to no snow the next.  So what to do?

I have decided that the American model (GFS) seems to be preforming the best for now.  The NAM model has been showing wild swings run-to-run and the European model (ECMWF) seems too cold.  None of the models are perfect, but the GFS seems to be closest to actual observations in the forecast.

Thus, here is the forecast for Columbia, South Carolina over the next seven days.  This was posted Sunday, January 26, 2014:

The seven-day forecast posted Sunday, January 26, 2014 for Columbia, SC.  Click on the image for a larger view.  Image Credit: WLTX-TV.

Tuesday, January 21, 2014

A Cold End to January 2014


A weather pattern we have seen many times since late October, 2013, has reappeared in its amplified form.  The ridge of high pressure in the upper atmosphere has been building since late last week along the Pacific Coast, stretching from northwest Mexico to Alaska.  This has pushed the jet stream far to the north into Alaska and the Yukon. 

The 500 mb pattern for North American at 00z January 21, 2014.  Click on the image for a larger view.  Image Credit: WLTX-TV.

The result has been unseasonably warm temperatures for this time of year.  It is still cold, but in Fairbanks the temperature averaged 24° F above normal on Monday.  There have been wild swings in Fairbanks, AK, this month with its coldest temperature of -41° F on January 12th & 13th, and its warmest temperature at 34° F on January 17th.  On that day the temperature averaged 32° F above normal.

Alaskan temperatures at midnight January 21, 2014.  These are warm readings for central Alaska in January.  Click on the image for a larger view.  Image Credit: WLTX-TV.

Sunday, January 5, 2014

Arctic Cold? I'll take a Double!


The new year is taking up where the old year ended.  The weather pattern discussed in a previous post continues to dominate North America.  Each time the pattern amplifies with a strong ridge-trough-ridge look, cold air invades the U.S.  The pattern relaxes and becomes more zonal causing milder conditions to return.  This is the up and down pattern that has resulted in a roller coaster of temperatures.

This was the 500 mb pattern for North America at 12z December 9, 2013.  Note the ridge-trough-ridge pattern.  Click on the image for a larger view.  Image Credit: WSI.

This was the 500 mb pattern for North America at 00z January 6, 2014 (taken from the ECMWF model 12 hours earlier.  Note the ridge-trough-ridge pattern returns.  Click on the image for a larger view.  Image Credit: WSI.

However, this time there has been a bit of a twist.  A surge of cold, arctic air invaded much of the country at the end of last week.  The temperature in Columbia dropped to 22° F Saturday morning.  The high pressure center moved quickly to the east causing winds to shift bringing clouds back into the area before daybreak.  This locked in the cold air for the weekend and there wasn’t much of a rebound in temperatures.

Monday, October 7, 2013

Karen Fizzles


Karen, the eleventh tropical storm of the season, dissipated along the central Gulf coast Sunday morning.  This was a relief to that area of the country, but was not expected from the forecast three days before.  The Federal Emergency Management Agency (FEMA) had already begun to recall personnel on furlough from the government shutdown.  Keep in mind that meteorologists at the National Weather Service (NWS) and National Hurricane Center (NHC) were already on the job, just not getting paid.

So what happened?

The tropical storm formed Thursday morning north of the Yucatan Peninsula and in my last post you can see what the track models were suggesting.  However, the storm was already being affected by a southwesterly shear aloft and dry air covered much of the western Gulf of Mexico.

The visible satellite picture of Karen for 21z Thursday, October 3. 2013.  The center of circulation is north of the Yucatan Peninsula.  Notice the asymmetry in the storm with all of the thunderstorms east of the center.  Dry air west of the center kept storms to a minimum.  Click on the image for a larger view.  Image Credit: UCAR.

Thursday, October 3, 2013

Karen Will Affect South Carolina


Tropical Storm Karen formed just north of the Yucatan Peninsula Friday morning (correction: that should be Thursday morning).  The system had been moving northwest through the western Caribbean since early in the week.  Conditions were finally favorable for development.

Now Karen takes aim on the U.S.  It has been moving slowly through the southern Gulf of Mexico and toward the north-northwest.  Hurricane hunters found winds of near 60 mph this morning prompting the upgrade to tropical storm status.

As of 11 p.m. EDT, Thursday, Tropical Storm Karen was 340 miles south of the mouth of the Mississippi River moving north-northwest at 10 mph.  Maximum sustained winds were 65 mph in squalls to the northeast.

The wind field around Tropical Storm Karen as of 00z October 4, 2013.  Winds are measured in knots.  The Yucatan Peninsula can be seen in the lower part of the image.  Click on the image for a larger view.  Image Credit: NOAA/NHC.

Sunday, May 5, 2013

A Cool Start To May 2013


Just as we were getting used to hotter springs, Mother Nature pulls a fast one.  It has been unusual to say the least for South Carolina weather since April 26th.  Cloudy, cool conditions have been the rule with plenty of rain.  The griping has begun as many are tied of conditions we normally attribute to Seattle.

My favorite tweet during the past week has been “Breaking news: This just in – Cleveland wants its weather back.”  I’m sure those in Cleveland might think this an improvement over what they normally get in early May.

So what has been happening?  Why has it been so cloudy and cool for so long?  When will this go away so that we can get on with summer?

The first half of spring was influenced by a weather pattern associated with a negative phase of the Arctic Oscillation.  This was described in the previous post.  However, that has not driving the weather pattern recently.  Instead the jet stream has retreated to the north leaving upper-level low pressure systems isolated from the main flow.  This has resulted in a blocking pattern where weather systems slow to a crawl and can persist for days.

The weather pattern at 500 mb (~18,000 ft) on Saturday, May 4, 2013 at 12z UT.  The jet stream had retreated farther to the north leaving isolated pockets of low pressure over the mid-latitudes.  Click on the image for a larger version.  Image Credit: WLTX-TV.

Friday, March 1, 2013

A Change In The March 2013 Outlook


The Climate Prediction Center (CPC) issues outlooks for the next month in the middle of the current month.  They will often issue an updated outlook near the last day of the current month.  Usually these projections do not vary much, but this month saw a substantial revision.

Computer models designed to forecast daily weather are run out to 15 days, four times each day.  Most are familiar with the 7-day forecast.  The CPC also issues 8-14 day outlooks for the second week of the forecast in additions to the monthly and seasonal outlooks that they make each month.

Beginning with the 8-14 day temperature outlook on February 21 and the one issued on February 28, it seems that the first half of March would be colder than normal for South Carolina as seen in the outlooks below.

The 8-14 day temperature outlooks.  The first one made February 21 and the second one (right) made February 28.  Click on the image for a larger view.  Image Credit: NOAA/CPC.

The reason for this projection is that the Arctic Oscillation (AO) has been in a negative phase with the forecast for it to become strongly negative next week.  This usually produces a cold outbreak for parts of the U.S.  Last year the AO was strongly positive and the U.S. saw the warmest March on record.

Wednesday, February 6, 2013

The Southeast Drought Continues


Droughts can be insidious.  Just when you think they’re gone, they’re back.  Actually it never went away in the Southeast, it just moved around.  The center of the drought began in northeast Florida in 2011 and moved to southern Georgia a year later.  Now the center of the drought is central Georgia and it is beginning to expand thanks to a dry January.


The Drought Monitor for the end of January 2011-13.  Click on the image for a larger view.  Image Credit: USDA.

The current drought began in the Southeast with the end of El Nino in 2010.  That was followed by two years of La Nina which brought drier than normal conditions particularly in the winter and spring.  The worst of the drought has been centered in central Georgia where extreme to exceptional drought conditions have persisted for two years.

However, drought conditions for southeast Georgia and northeast Florida actually disappeared this past summer thanks to two tropical weather systems (Beryl & Debby) which inundated the region with rain in late May and June.  Drought is creeping back into those areas.

Monday, November 19, 2012

Sandy: A Story of Survival


There have been a number of stories in the media of surviving Hurricane/Superstorm Sandy.  Tragically more than 200 people have lost their lives from the Caribbean to the Northeast.  Sandy was a hurricane as it moved through the Caribbean toward Cuba.  A number of lives were lost in Haiti due to the excessive rains.  The country was still trying to recover from the devastating earthquake in January, 2010.  Sandy has been a setback for the nation.

We have seen the images and heard the stories of Sandy from those affected in the Northeast.  There have been two stories that have jumped out at me in the past week.  The first was published here in the New York Times.  Stories like this remind me of the same stories told by hurricane survivors along the Southeast & Gulf coasts.  Why would anyone stay after seeing the devastation brought by Sandy?

Oblique aerial photographs of Mantoloking, NJ. View looking west along the New Jersey shore. Storm waves and surge cut across the barrier island at Mantoloking, NJ, eroding a wide beach, destroying houses and roads, and depositing sand onto the island and into the back-bay. Construction crews with heavy machinery are seen clearing sand from roads and pushing sand seaward to build a wider beach and protective berm just days after the storm. The yellow arrow in each image points to the same feature.  Image Credit: USGS.

Then there is this story of survival by Steve Hartmann of CBS.  His is a story of a son who decided to stay to protect the house.  I encourage everyone to see this.  It is one of the best examples of why you should never stay to protect property.  Fortunately no one was killed in this example.


(For Apple users, use this link)
There are many lessons to be learned from Sandy.  CBS This Morning briefly mentioned a few thoughts as they interviewed a reporter from Time magazine.


(For Apple users, use this link)
It will take time to recover from Sandy.  However, this is the time to think about the next storm.  Many will get money from FEMA or some other source to rebuild.  But why build in a vulnerable spot when the next storm will simply inflict the same result?

Andy Revkin of Dot Earth wrote an article explaining how so much was at risk in Sandy.  Simply rebuilding as before is a waste of money in my view.  Keep in mind that much of this is funded by taxpayers.  I do not mind helping victims with their loss, but to simply put the money back in harm’s way is a waste.

Local and state governments are reluctant to restrict rebuilding in vulnerable areas, because of the loss of revenue.  To declare land off limit to rebuilding is to reduce the revenue base.  Yet the cost to taxpayers is increasing.  Many of the same issues are happening in South Carolina and the result will likely be the same as in Sandy.

Furthermore, we need to rethink the infrastructure.  Areas need to be fortified and the electrical grid upgraded to weather future storms.  Of course the entire national grid needs to be upgraded to the 21st century.  The frequency and severity of storms is increasing.  If we are to adapt to a changing climate, then this must be done.

Last night Nova aired a special program on PBS called Inside the Megastorm.  It is a look at the forecasts for Sandy, surviving the storm, and a look at the future.  If you missed the program, here it is:


Watch Inside the Megastorm on PBS. See more from NOVA.

The forecast for Sandy was excellent.  I first wrote about the potential eight days before landfall here.  There was plenty of warning that the storm was coming and that it would be bad.  Yet, there could have been better communication and preparation for the storm.

Still Sandy was an unusual hurricane.  I will address this in a latter post.

Monday, October 29, 2012

Sandy Update: Monday


Update: 10 p.m. EDT

Sandy made landfall about 5 miles southwest of Atlantic City, New Jersey around 8 p.m. EDT.  It came ashore as an extratropical cyclone as Sandy made a quick transition during the late afternoon.  The storm still had sustained winds up to 80 mph and was moving west-northwest at 21 mph.  Sandy slowed as it moved inland and may slow some more over the next few hours.

The windfield around Sandy as of 9 p.m. EDT, October 29, 2012.  Click on the image for a larger view.  Image Credit: NOAA.
Notice the area colored in yellow.  These are winds in the range of 45 to 60 mph.  This is a very large area of high winds and it is pushing water into New York harbor due to the southeast winds.  It produced a record flood for lower Manhattan.

Sandy continues to move inland and was near Wilmington, Delaware as of 10 p.m. EDT.  Inland winds of 40 to 50 mph were common.  This heaviest rains were now south and west of the center.

The radar from Dover AFB as of 10 p.m. EDT, October 29, 2012.  Sandy was centered southwest of Wilmington, Delaware.  Image Credit: WLTX-TV.
Heavy snows are now falling in West Virginia and western Virginia.  The snow extends south into the mountains of North Carolina, but amounts have been generally light so far.  More snow is expected overnight and through the day on Tuesday.

Update: 6 p.m. EDT

Sandy is now extratropical.  However, that does not alter the overall pattern of the storm.  It has been making rapid transition during the past few hours.  The 5 p.m. analysis of the wind field is below with the radar composite from 5:48 p.m.  The storm is approaching Cape May, New Jersey and should make landfall in about an hour.

The wind field over the radar.  Click on the image for a larger view.  The storm is extratropical.  Image Credit: NOAA.
 

Update: 2 p.m. EDT

Hurricane Sandy is accelerating and turning to the west-northwest.  The storm has been moving northwest over the past three hours, but it is clearly turning.  Forward motion is now 28 mph and central pressure is 940 mb (27.76 in.).  Maximum sustained winds still at 90 mph, but it appears that an area of strongest winds are developing north of the center.

Windfall analysis as of 1 p.m. EDT October 29, 2012.  Image Credit: NOAA.
Radar image of Sandy as of 2 p.m. EDT October 29, 2012.  Image Credit: WLTX-TV.
The faster forward motion means that the center will cross the coast earlier than forecast.  In addition, it could move faster as it is affected by a strongly negatively tilted trough shown in this mornings upper-air analysis.  The jet stream may cause a further deepening of the pressure.

Analysis of the 250 mb level showing strong winds along the East Coast.  Image Credit: NCAR/RAP.

Saturday, October 27, 2012

The Dance Begins


The upper-level trough that has been moving through the central part of the U.S. is beginning to affect Hurricane Sandy.  It is moving east and energy will be moving into the base of the trough that will cause to tilt negatively.  Initially this will push the hurricane to the northeast.  However, as the trough gets close and the upper-level winds back, Sandy will turn north and then westward moving inland in the Northeast.

The 500 mb analysis for Friday evening October 26, 2012.  Click on the image for a larger view.  Image Credit: WSI.

Wind shear has been increasing over the hurricane and it is beginning to resemble a hybrid system.  A warm core typical of the tropical cyclone is in place, but the center does not have a ring of thunderstorms surrounding it.  NASA imagery showed the thunderstorms displaced to the north Friday evening.